Flight Data Monitoring Explained — What Airlines Track and Why
Flight data monitoring is one of those aviation concepts that sounds dry until you realize it’s probably saved thousands of lives without most passengers ever knowing it existed. I spent several years working adjacent to airline safety programs — not as a pilot, but close enough to sit in on debrief sessions where FDM findings were discussed — and the first time I saw a readout of what gets recorded on a single commercial flight, my reaction was something close to disbelief. The sheer volume of data captured between pushback and gate arrival is staggering. We’re not talking about a black box sitting quietly in the tail section. We’re talking about an active, continuous monitoring ecosystem that most airlines now treat as their primary tool for proactive safety management.
This article breaks down how flight data monitoring actually works, what it tracks, and why it matters — written for pilots, enthusiastic aviation nerds, and anyone who has ever looked at an IATA safety circular and felt their eyes glaze over by paragraph three.
What Flight Data Monitoring Actually Tracks
Modern FDM systems — sometimes called Flight Operational Quality Assurance, or FOQA, particularly in the United States — record an extraordinary range of parameters during every flight. On a typical narrowbody like a Boeing 737-800 or an Airbus A320, you’re looking at somewhere between 700 and 1,000 discrete data parameters being captured. On widebody long-haul aircraft, that number climbs past 4,000.
Let me put some specifics on this, because the abstract number doesn’t mean much on its own.
The Core Parameters — Altitude, Speed, and Forces
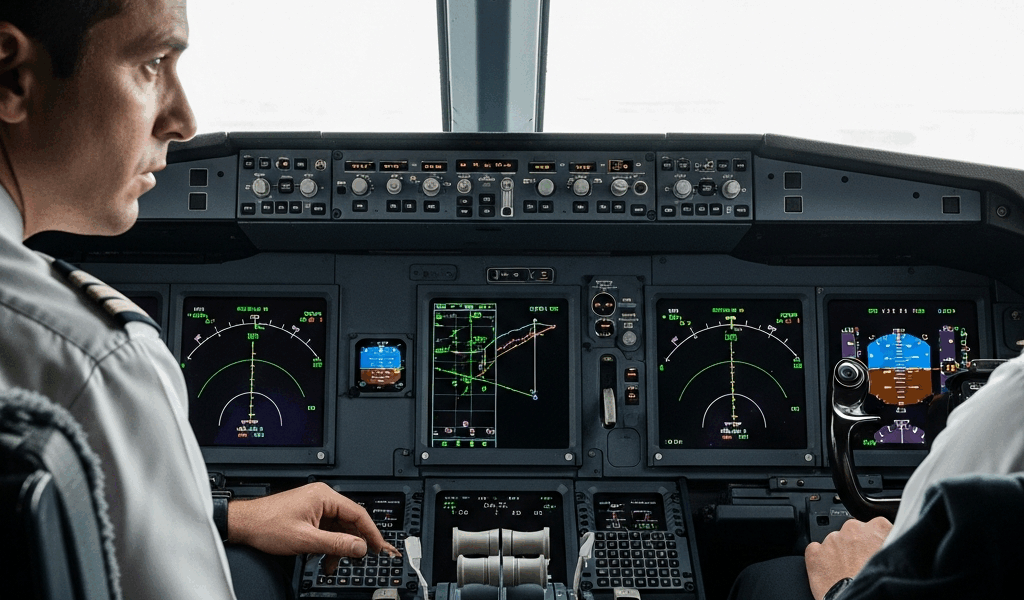
Barometric altitude gets recorded continuously, typically at a resolution of one foot and a sampling rate of one reading per second on older systems, or up to eight readings per second on newer digital flight data acquisition units (FDAUs). Airspeed — both indicated and computed — is logged alongside Mach number, angle of attack, and vertical speed. Normal acceleration, lateral acceleration, and longitudinal acceleration (the G-force family) are all captured, usually at eight samples per second during critical phases like takeoff and landing.
That 8Hz sampling rate during approach and touchdown isn’t arbitrary. Hard landing detection is one of FDM’s most practically useful functions. A normal touchdown in a 737 produces around 1.2 to 1.4 G of vertical acceleration. Anything above 2.0 G triggers a maintenance inspection requirement. FDM catches every single one of those exceedances automatically. No pilot self-reporting required. No relying on passenger complaints.
Engine Health — The Numbers Airlines Actually Worry About
Engine parameters make up a significant chunk of the data stream. On a CFM56-7B-powered 737 NG, the system captures exhaust gas temperature (EGT), N1 fan speed, N2 core speed, fuel flow in kilograms per hour, oil temperature, oil pressure, and engine vibration levels. EGT margin — the difference between actual EGT and the certified maximum — is watched closely by engineering teams because a shrinking margin over months of data is often the first sign of an engine trending toward trouble.
This is where FDM gets genuinely interesting from an engineering standpoint. An engine might perform perfectly on every single flight. Pass every maintenance check. Show nothing wrong on visual inspection. But if the EGT margin has been quietly narrowing by two degrees per month over six months, FDM will surface that trend long before it becomes an airworthiness issue.
Flight Control Surfaces, Flap Settings, and Everything Else
Beyond speed and engine data, FDM systems record control surface positions — elevator, aileron, rudder deflection angles — as well as flap and slat configuration throughout the flight. Autopilot engagement status, flight director commands, autothrottle mode, and even specific button presses on the Mode Control Panel get captured on modern systems. Fuel quantity, center of gravity shifts as fuel burns off, hydraulic pressures, and environmental control system data round out the picture.
The full parameter list for an A330 running Airbus ACMS (Aircraft Condition Monitoring System) runs to roughly 60 printed pages. I’ve actually seen it printed. It’s sitting somewhere in a binder in an office I used to visit regularly. Dense doesn’t begin to describe it.
How FDM Catches Problems Before They Happen
Probably should have opened with this section, honestly, because this is where the concept goes from interesting to genuinely compelling. The whole point of flight data monitoring isn’t to catch pilots doing something wrong in real time. It’s to identify patterns — small deviations from stable profiles that might individually seem minor but collectively indicate a systemic risk.
Unstable Approaches — The Case Study Everyone in Aviation Knows
Unstabilized approaches are implicated in a disproportionate share of approach and landing accidents. IATA and the Flight Safety Foundation have both identified them as a top risk category for decades. The definition is specific — by 1,000 feet above airport elevation in IMC, or 500 feet in VMC, an approach should meet defined criteria for airspeed, descent rate, configuration, and flight path.
What FDM revealed when airlines first started systematically analyzing approach data was uncomfortable. Stabilization criteria were being violated far more frequently than anyone had assumed. One European carrier, in its first year of FOQA implementation, found that approximately 3.5% of all approaches failed at least one stabilization parameter below the gate altitude. Pilots weren’t filing reports for most of these. They didn’t need to — the approaches ended uneventfully. But the data showed a risk exposure that voluntary reporting had completely missed.
Confronted by that data, the airline restructured its approach briefing procedures, adjusted its stabilized approach policy documentation, and ran a targeted simulator training campaign. The violation rate dropped to under 0.8% within eighteen months. No incidents in between. That’s FDM working exactly as intended — catching a trend, enabling an intervention, before anyone gets hurt.
Hard Landings — Detection, Inspection, and the Numbers
Hard landing programs are probably the most operationally visible FDM function for maintenance teams. Every major airline has an automatic hard landing threshold set in their FDM software — typically 2.1 G for initial alert on most Boeing types, with higher thresholds triggering progressively more intensive inspections. Boeing’s Structural Repair Manual specifies inspection requirements based on G-loading, and the FDM system provides the triggering data automatically.
Before systematic FDM, hard landing detection relied on crew reports and passenger complaints. Crews sometimes underestimated touchdown forces — human perception of vertical acceleration is surprisingly unreliable. There are documented cases of aircraft accumulating structural fatigue from repeated moderate hard landings, none of which individually crossed the self-reporting threshold, over periods of years. FDM closed that gap entirely.
One regional carrier operating Bombardier Dash 8 Q400 aircraft found, after implementing FDM in 2011, that landing G-forces at one specific airport were running consistently 15 to 18% higher than at comparable airports. Investigation found a combination of factors — a displaced threshold, a common visual glidepath illusion at that runway, and a crew cultural tendency to land long to avoid a bumpy rollout. Targeted training fixed it. The aircraft involved had accumulated more touchdown stress than the records showed. FDM found it.
Exceedances — Speed, Altitude, and the Gray Zones
FDM systems are programmed with exceedance thresholds for dozens of parameters. VMO/MMO (maximum operating speed) exceedances, overspeed on flap extension, bank angle above operational limits, descent rate thresholds during approach. Each exceedance generates an event in the FDM software — typically something like Lido Flight Recorder or Teledyne SSFDR — that gets reviewed by a safety analyst.
The review isn’t punitive. That’s the critical design principle of a functional FDM program. Data is typically de-identified before safety teams see it, or handled under a non-punitive safety reporting culture framework. The goal is to understand frequency and context, not to discipline individual crews. Airlines that have tried to use FDM data punitively have found their programs collapse rapidly as crews find workarounds or union agreements restrict data access.
FDM vs FDR — Related But Different
This is probably the most common point of confusion when people first encounter FDM, and I’ll admit it confused me too when I first started paying attention to this space. The Flight Data Recorder — the black box — and a Flight Data Monitoring program sound almost identical. They are not the same thing, and the distinction matters.
The Black Box — Accident Investigation, Not Prevention
The FDR is a crash-survivable device. Required on all commercial aircraft above a certain weight threshold by FAA FAR 121.343 and equivalent international regulations. It records a minimum set of parameters — the FAA mandates at least 88 parameters for newer aircraft types — onto a crash-protected recorder using orange-painted, steel-encased solid-state memory designed to survive 3,400 G of impact force, 1,100 degrees Celsius for 30 minutes, and 20,000 feet of seawater pressure.
The FDR’s entire purpose is retrospective. It exists to tell investigators what happened after an accident. The data is not routinely accessed during normal operations. Airlines don’t have analysts reviewing FDR data after every flight looking for trends. That’s not what it’s for. The CVR — Cockpit Voice Recorder — operates on the same principle. Accident investigation tools, both of them.
FDM — The Proactive, Continuous Program
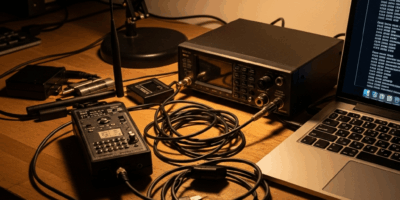
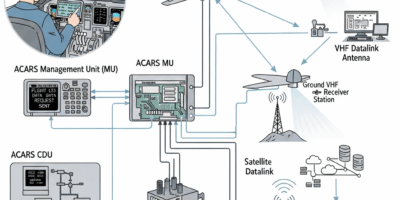
Flight Data Monitoring uses the same underlying data stream as the FDR — often literally the same sensor inputs — but routes it through a separate system optimized for routine analysis. The Quick Access Recorder (QAR) is the typical data collection device. On older aircraft, it used 8mm magnetic tape cartridges that ground crews physically swapped out after flights. Modern systems transmit data wirelessly via ACARS or broadband datalink before the aircraft even reaches the gate.
The FDM software — products like AGS (Aviation Graphical Solutions) FDM, Scaled Analytics, or AIRBUS’s own Flight Data Services platform — processes the raw binary data against the aircraft’s specific parameter encoding documentation (the DFDR Spec or equivalent) and runs it through event detection algorithms configured by the airline’s own safety department.
FDM data is accessed constantly. Safety analysts at major carriers review FDM outputs daily. Fleet managers use aggregated FDM trends to make maintenance decisions, route planning adjustments, and training program revisions. The data is live and operational in a way that FDR data simply never is during normal airline operations.
When Each One Matters
FDR data matters after something goes wrong. It’s the forensic record. FDM data matters because of everything that didn’t go wrong — the interventions it enabled, the patterns it surfaced, the quiet near-misses it helped prevent before they became accidents. Both are essential. They’re complementary tools serving entirely different functions within aviation safety management.
The mistake I made early on was treating FDM as a more sophisticated version of the black box. It’s not. It’s closer to a continuous health monitoring system — think of it like the difference between a hospital’s post-mortem records and a patient’s ongoing vitals monitoring. One tells you what killed someone. The other helps keep them alive.
Airlines that treat FDM as just a regulatory compliance checkbox — yes, we have a program, yes, we reviewed the data, file it away — consistently show worse safety metrics than carriers that genuinely integrate FDM outputs into operations. The data doesn’t help anyone sitting in a folder. The entire value proposition is in the analysis, the follow-through, and the willingness to act on uncomfortable findings even when the flights all landed safely.
That’s what flight data monitoring actually is. Not a mystery box. Not a surveillance tool. A systematic, data-driven feedback loop that gives aviation the ability to learn from flights that never made the news — and that’s exactly why it works.

Stay in the loop
Get the latest aerodata updates delivered to your inbox.