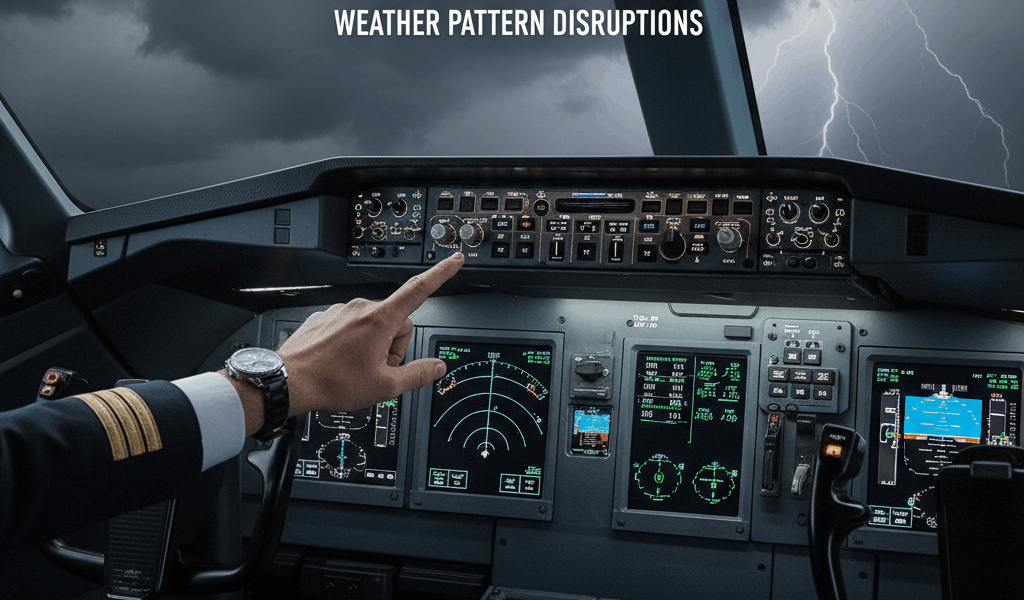
Flight delays have gotten complicated with all the finger-pointing and oversimplified explanations flying around. Today, I will share it all with you.
The number that jumps off the page: weather is responsible for roughly 35% of all flight delays in the United States. But that headline number barely scratches the surface of what’s really happening behind the scenes.
Breaking Down the 35%
The FAA tracks delay causes across five major buckets. Weather sits on top every single year:
- Weather: 35-40% of delays
- Air carrier issues: 25-30% (crew problems, maintenance, operational hiccups)
- National Aviation System: 20-25% (ATC staffing, airport infrastructure)
- Security: Less than 1%
- Late-arriving aircraft: 5-10% (the cascade effect, and this one’s a big deal)
Here’s what most people don’t realize though. These categories bleed into each other constantly. That late-arriving aircraft? Probably late because of weather at its origin. That air carrier delay? Might be because crews had to be repositioned after weather somewhere else messed up the rotation. When you trace the threads back, weather’s true footprint almost certainly exceeds the official 35% figure. I’ve seen internal airline analyses that put it closer to 50%.
The Anatomy of Weather Delays
Different weather phenomena mess with operations in very different ways, and understanding the distinction matters:
Thunderstorms are the heavy hitters. Convective activity forces aircraft to deviate around cells, burning extra fuel and stretching flight times. On the ground, active storms can cut airport arrival rates by 50-70% as controllers add spacing for wind shear avoidance. I’ve watched a single afternoon of thunderstorms at Atlanta Hartsfield-Jackson delay 300+ flights. It cascades fast.
Low visibility from fog or low ceilings is sneakier. It reduces capacity more subtly but just won’t quit. Airports under instrument conditions have to increase aircraft separation, which drops hourly arrival rates from 60+ down to 30-40. San Francisco is notorious for morning fog that basically sets the tone for delays all day long. If you’ve flown through SFO in summer, you’ve experienced this firsthand.
Winter weather hits you from multiple angles simultaneously. De-icing adds 15-45 minutes per departure. Snow removal temporarily shuts down runways. Reduced braking action means longer landing distances and bigger gaps between arrivals. Everything compounds.
Wind causes delays when the runway configuration that handles the most traffic becomes unusable due to crosswind limits. Airports with parallel runways can push 90+ arrivals per hour in ideal conditions but may drop to 50-60 when they’re forced into single-runway operations.
The Cascade Effect
Because the cascade effect is where weather transforms from a local problem into a nationwide mess.
An afternoon thunderstorm in Dallas doesn’t just delay Dallas flights. It ripples outward through the entire network. An aircraft scheduled to fly Dallas to Denver to Seattle to Anchorage might not make it to its first stop until evening, triggering delays down the entire chain. Crews hit their duty time limits and have to be replaced, but reserve crews might not be anywhere near the affected cities. Passengers miss connections, need rebooking on flights that are already packed.
Airlines estimate that for every minute of weather delay at a major hub, total system delay grows by 3-5 minutes through these cascading effects. Let that sink in for a second. One minute becomes five. A two-hour ground stop at a single hub can disrupt thousands of flights across the country.
Seasonal Patterns
Weather delays follow pretty predictable seasonal rhythms, which is both good and bad. Good because airlines can plan for it. Bad because there’s not much you can do about the weather.
Summer (June through August): This is peak delay season, hands down. Afternoon thunderstorms develop like clockwork, especially in the Southeast and Great Plains, and they slam right into the evening departure banks when everyone’s trying to get home.
Winter (December through February): The second-worst stretch, concentrated at northern airports. Holiday travel volumes make everything worse. A single nor’easter can delay 5,000+ flights up and down the East Coast. I’ve seen it happen multiple times, and it never gets less chaotic.
Spring and Fall: Generally the most reliable flying seasons. Spring occasionally brings severe weather systems and fall can deliver early snowstorms that catch airports off guard, but overall these are your best bet for on-time performance.
Regional Hotspots
Geography makes certain airports more vulnerable than others:
San Francisco (SFO): Marine layer fog creates predictable morning delays from May through October. The parallel runway layout makes SFO especially sensitive to visibility conditions. Locals know to book afternoon flights whenever possible.
Chicago O’Hare (ORD): Lake-effect snow, winter storms, summer thunderstorms — O’Hare gets hit from every direction. Its role as a major connecting hub amplifies every delay into a national event.
New York area (JFK, EWR, LGA): Three tightly packed airports already running at near-capacity in perfect weather. Any degradation — thunderstorms, snow, even steady rain — triggers immediate ground stops. Newark might be the single most delay-prone major airport in the country.
Denver (DEN): Spring and fall snowstorms can materialize fast, but DEN’s de-icing operation is excellent and they typically recover quicker than most.
How Airlines Respond
Modern airlines have gotten surprisingly sophisticated at managing weather disruptions:
Preemptive cancellations: When big weather is on the radar, airlines may cancel flights 24-48 hours out. It feels counterintuitive, but planned cancellations let them rebook passengers ahead of time and prevent crews and aircraft from getting stranded in the wrong cities. It’s one of the smarter moves in the playbook.
Hubbing through weather: Airlines reroute aircraft around forecast weather, swapping to alternate hubs or direct routings that dodge problem areas entirely.
Speed adjustments: Planes already in the air may slow down when their destination has a ground stop, saving fuel and avoiding holding patterns. It’s a small thing, but it adds up across hundreds of flights.
Swap operations: Ops teams constantly juggle aircraft and crews to maximize what they can fly. If a flight can be operated with available resources, it goes, even if the originally scheduled airplane is stuck somewhere else.
The Technology Factor
Forecasting and ops technology have come a long way:
Collaborative Decision Making programs share real-time data between airlines, airports, and ATC, letting everyone plan better when weather approaches.
Traffic Flow Management systems hold aircraft at their origin airports with ground delay programs rather than burning fuel in holding patterns at backed-up destinations. Much more efficient.
Better radar and satellite data enable more precise forecasts, which means strategic decisions get made earlier and with more confidence.
That said, weather is still fundamentally unpredictable. Convective forecasts beyond 6-8 hours carry real uncertainty, and exact timing of precipitation can shift by hours. No amount of technology completely solves that.
Passenger Impact
Weather delays hit travelers in ways beyond just the schedule disruption:
- Rebooking nightmares: Peak travel periods have very few empty seats for displaced passengers
- Hotel and meal costs on you: Airlines typically won’t cover expenses for weather delays since it falls under the “act of God” exclusion
- Missed connections: Minimum connection times assume everything runs normally — weather blows that assumption apart regularly
- International complications: A weather delay on your outbound US flight can cause missed international connections, sometimes requiring new visas or rebooking on completely different carriers
The Future of Weather Delays
Climate change is likely making this worse, not better. Research from atmospheric scientists suggests we’re heading toward:
- More intense convective activity and stronger thunderstorms
- Higher frequency of extreme weather events across the board
- Wilder winter swings, with intense storms followed by mild stretches
- New operational headaches from extreme heat affecting aircraft performance at already-hot airports
Airlines are pouring money into better forecasting tools and building more schedule flexibility to absorb increased weather variability. Whether it’s enough remains an open question.
Key Takeaways
- Weather drives roughly 35% of flight delays officially, with cascade effects pushing the real number significantly higher
- Thunderstorms cause the most severe disruptions while low visibility creates the most persistent ones
- Summer and winter are the worst seasons, each with distinct regional patterns
- Airlines use preemptive cancellations and sophisticated ops tools to mitigate the damage
- Climate change will likely make weather delays more frequent in the decades ahead
Data sources: FAA Air Travel Consumer Report, Bureau of Transportation Statistics, airline operations data

Stay in the loop
Get the latest aerodata updates delivered to your inbox.