A leased Boeing 737 costs roughly $400,000 per month whether it flies or sits on the ramp. Every hour that aircraft is parked, the airline hemorrhages money on a depreciating asset generating zero revenue. This is why aircraft utilization rate drives more operational decisions at airlines than almost any other single metric — and why shaving 15 minutes off a turnaround can be worth millions across a year.
What Aircraft Utilization Rate Actually Measures
Utilization rate is block hours per day per aircraft. Block time starts when chocks are pulled at the departure gate and ends when chocks go back on at the arrival gate. Not airborne time (which strips out taxi). Not maintenance flight hours (which typically match airborne time). Block hours capture the full gate-to-gate picture: taxi out, takeoff, cruise, descent, taxi in.
Why block hours and not flight hours? Because the costs that actually matter run on calendar time, not time in the air. Lease payments land monthly whether the aircraft flew 300 hours or 200. Depreciation follows a schedule. Crew costs accrue per duty day. Airlines push block hours higher to spread those fixed costs across more revenue flights. An aircraft logging 12 block hours daily carries the same lease burden as one doing 8 — but produces 50% more revenue to absorb it.
Industry Benchmarks: Who Gets the Most from Each Aircraft
The gap between carriers is substantial, and it maps almost perfectly to business model:
Low-cost carriers: Ryanair runs approximately 9.1 block hours per day per aircraft across its 737 fleet. Southwest historically hit 12+ hours on strong operational days, though the 2021-2023 pilot shortage pulled those numbers down. The entire LCC playbook depends on fast gate turns and high utilization — revenue comes from moving seats, not selling premium cabins.
Legacy carriers: United and Delta average 8-10 block hours daily on narrowbodies handling domestic and short-haul international. Widebody fleets — 777s, 787s, A350s — clock higher, typically 12-14 hours, because a single transatlantic segment can run 8-12 block hours. One long-haul rotation covers what a narrowbody needs three or four short-haul turns to achieve.
Regional carriers: Typically 6-8 block hours. Segments are short (45-90 minutes), which means more daily turns but proportionally more ground time per block hour. The turnaround overhead eats into utilization when flights themselves are that brief.
The widebody structural advantage is real. A 787 flying JFK-LHR-JFK covers about 14 block hours in two segments with one turnaround. A 737 needs five or six domestic segments and five or six gate turns to get there — each turn being another opportunity for delay to cascade.
How Utilization Drives Cost Per Available Seat Mile
The math is blunt once you work through it. That leased 737 at $400,000 monthly: at 9 block hours per day with 162 seats, the fixed cost per block hour runs about $270, or $1.67 per seat per block hour.
Push the same aircraft to 12 block hours daily and the per-hour fixed cost drops to $200, or $1.24 per seat per block hour. Same lease, same aircraft, same seats. Just more flying. That is a 26% reduction in fixed CASM from utilization improvement alone — no fuel efficiency gains, no labor concessions, no route restructuring required.
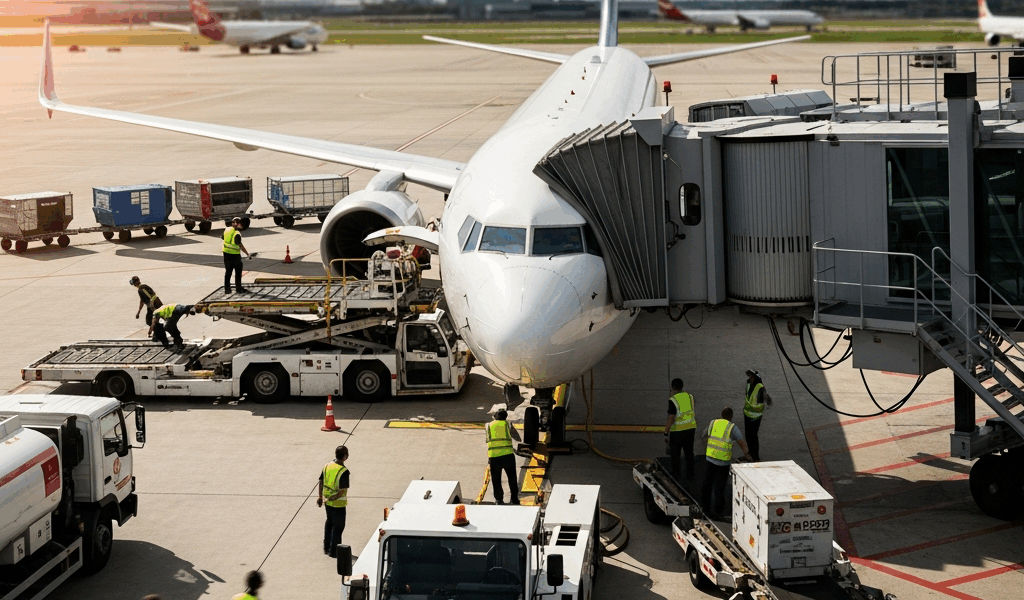
This is the economics behind Southwest’s obsessive 25-minute turnaround culture. Every 10 minutes saved per turn, multiplied by six daily turns, across 800 aircraft, across 365 days, adds up to tens of thousands of extra block hours annually. Those hours don’t need new airplanes, new gates, or new pilot classes — just faster work at the gates you already operate.
The gap between 9 and 11 daily block hours across a fleet of 200 narrowbodies translates to roughly a 22% fixed CASM reduction. For a carrier spending $2 billion annually on aircraft-related fixed costs, that works out to a $440 million structural advantage. This is why operations teams track turnaround performance to the minute, and why a 10-minute average improvement gets discussed at the board level.
What Kills Utilization: Disruption Types and Their Impact
Utilization has four primary enemies, each with its own recovery profile:
Weather: Unplanned and largely outside anyone’s control. Thunderstorm ground stops, winter deicing queues, fog-induced visibility holds. Industry average runs 2-4% utilization loss per year from weather. Carriers with hubs in weather-prone cities — Chicago, Denver, Dallas in convective season — absorb more than airlines based in the sunbelt.
Maintenance: Both the planned kind and the kind that wakes up the MOC at 2am. Scheduled heavy checks (C-checks every 18-24 months, D-checks every 6-10 years) pull aircraft from service for days or weeks. Unplanned AOG events — bird strikes, hydraulic leaks, nuisance sensor faults — can ground a specific tail number for hours to days while parts get sourced and shipped. Carriers running younger fleets tend to see fewer unscheduled hits.
Crew shortages: The post-COVID pilot shortage created genuine structural utilization decline from 2021 through 2023. Airlines had airplanes and passenger demand but couldn’t staff the flights. It was the first time in modern commercial aviation that crew availability — not aircraft availability — became the binding constraint on fleet utilization at major carriers.
Slot restrictions: Congested airports — Heathrow, JFK, O’Hare, Haneda — cap hourly operations. An airline might have the metal and the crew to squeeze in another turn, but no landing slot available. This creates a hard utilization ceiling that operational efficiency alone cannot punch through.
How to Read Utilization Data in Context
Raw utilization numbers without context mislead more often than they inform. A few adjustments matter when comparing across carriers:
Fleet type mix: An airline reporting 11 hours average utilization with a 60% widebody fleet is not necessarily more efficient than a 9-hour narrowbody operator. Widebodies structurally log more block hours per segment. Compare narrowbody-to-narrowbody and widebody-to-widebody for benchmarks that actually mean something.
Seasonal variation: Short-haul leisure carriers spike hard in summer — June through August utilization can run 15-20% above January levels. Long-haul carriers show less swing because business demand and route diversity smooth the curve. Annual averages tell the real story. Cherry-picked summer months do not.
Fleet age: Older aircraft accumulate more unscheduled maintenance events. A 20-year-old 737NG will log more AOG days annually than a 3-year-old MAX, dragging average utilization down. Airlines running young fleets carry a structural advantage that compounds as the fleet ages.
Where to find the data: The Bureau of Transportation Statistics Form 41 (public for US carriers) reports monthly block hours by individual aircraft registration — the most granular public dataset available. CAPA Centre for Aviation tracks global fleet utilization. IATA publishes seasonal trends and industry-wide averages. For US carriers, BTS Form 41 is always the starting point because it is actual reported operational data, not estimates or projections.
Utilization is one of the clearest windows into how an airline actually runs day to day. High numbers mean fast turnarounds, reliable maintenance, adequate crew staffing, and efficient scheduling all working together. When utilization drops, one or more of those systems is under pressure — and the financial impact lands in CASM before it shows up anywhere else on the income statement.

Stay in the loop
Get the latest aerodata updates delivered to your inbox.